Monitoring server performance is a key part of maintaining a healthy and efficient Linux system. Whether you manage a small VPS or a large production server, it’s important to keep track of CPU, memory, and process usage to detect issues early and ensure optimal performance.
htop is one of the most popular and user-friendly tools for real-time system monitoring. It provides a colorful, interactive interface that displays detailed information about system resource usage and running processes offering a clearer and more intuitive view than the traditional top command.

htop – Real-Time Process and Resource Monitor
htop is an interactive system-monitoring tool that displays CPU, memory, and process usage in a clear, color-coded interface. It’s more user-friendly than the traditional top command.
Install htop
For Debian and Ubuntu
sudo apt update
sudo apt install htop -y
For CentOS / RHEL / AlmaLinux / Rocky Linux
sudo dnf install epel-release -y
sudo dnf install htop -y
Run htop:
htop
This displays a live summary of CPU, memory, and process usage in an easy-to-read format.
Understanding the htop Interface
System Summary (Top Section)
At the very top, you’ll see live system metrics:

- CPU bars (0, 1, 2, 3) → Show per-core usage.
- Green = User processes
- Red = System (kernel) usage
- Blue = Low-priority (nice) tasks
- Orange/Magenta = Hardware or software interrupts
- Mem → Memory (RAM) usage bar.
- Shows how much memory is in use vs total available.
- Swp → Swap memory usage (if any).
On the right-hand side, you’ll find:
Tasks: 23, 22 thr; 103 kthr; 1 running
Load average: 0.01 0.06 0.03
Uptime: 00:04:30
Meaning:
- Tasks: Total running and sleeping processes.
- Load average: System load over 1, 5, and 15 minutes (lower is better).
- Uptime: How long the system has been running since last reboot.
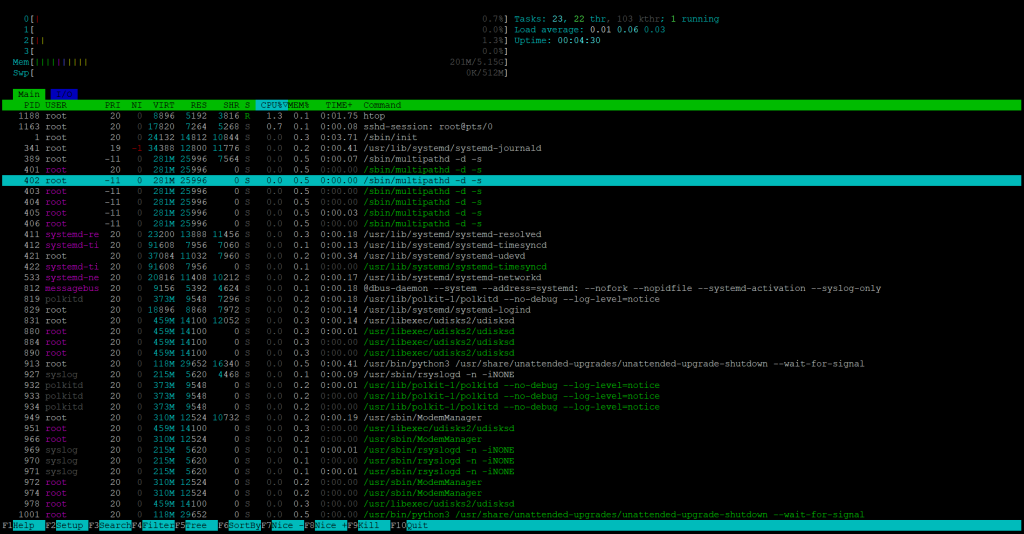
The lower half of the screen lists all running processes in real time.
Each row represents one process and displays useful details such as:
- PID : the process ID number.
- USER : the account that owns the process.
- PRI and NI : priority and “nice” value used by the scheduler.
- VIRT, RES, and SHR memory usage information (virtual, resident, and shared memory).
- S :process state (R = running, S = sleeping, Z = zombie).
- CPU% and MEM% :how much CPU and memory each process consumes.
- TIME+ : total CPU time the process has used.
- Command : the name or full command of the process.
For example, in screenshot, the htop process itself (PID 1188) is using about 1.3% CPU and 0.1% memory.
Footer (Bottom Section)
The bar at the bottom lists the most common shortcuts for interacting with htop:
- F1 – Help
- F2 – Setup (to customize what’s displayed)
- F3 – Search for a process by name
- F4 – Filter processes
- F5 – Tree view to see parent/child relationships
- F6 – Sort by CPU, memory, or other parameters
- F9 – Kill a process
- F10 – Quit htop
You can navigate using the arrow keys or your mouse.
What It Does
- Displays real-time CPU, RAM, and swap usage.
- Shows all running processes with their PID, user, and resource consumption.
- Allows you to sort processes by CPU or memory usage interactively.
- Supports killing or renicing processes directly from the interface.
Why It’s Useful
htop helps you quickly identify which processes consume the most resources. It’s ideal for diagnosing system slowdowns, checking load averages, or spotting runaway processes.
Purchase a KVM VPS – Choose a KVM VPS plan from us that suits your requirements
KVM SSD Plans – https://crowncloud.net/ssd_kvm.php
NVMe SSD KVM VPS Plans – https://crowncloud.net/nvme_kvm.php
AMD Ryzen SSD KVM VPS – https://crowncloud.net/ssd_amd_ryzen_kvm.php
Intel i9 12900K SSD KVM VPS Plans – https://crowncloud.net/ssd_intel_i9_kvm.php