As part of our series highlighting the redesign/changes in our panel, today we’re moving to the Task Log!
Redesigned Task Log Interface
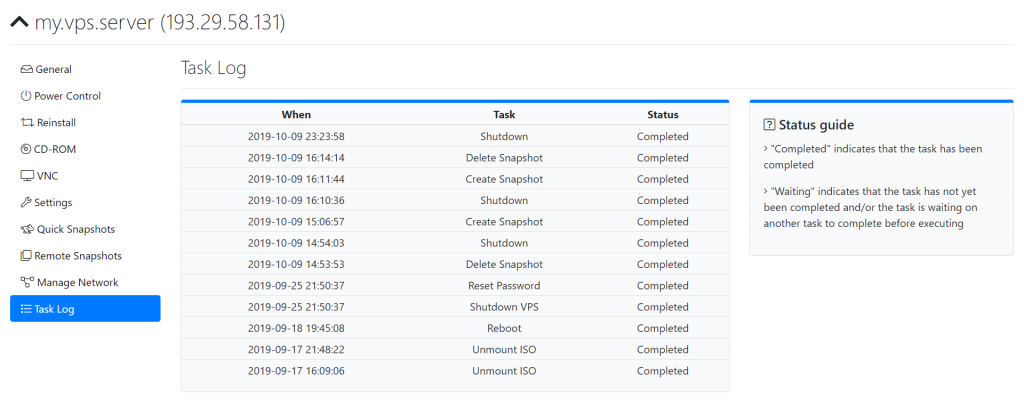
The Task Log interface remains basic but quite important in highlighting completed tasks and pending tasks,
We have redesigned the interface to be more sleek when viewing multiple tasks. We plan to introduce a method to view all the tasks ran previously as well.
Continuing with our previous series of previewing out our new user interface, today we’re happy to preview out the new & redesigned Manage Network Interface!
To begin with, we’ve split the Manage Network interface into 3 parts, to give us more “space” to work with for each item,
Network Addresses
Network Usage Graph
Previous Usage
Network Addresses
The Network Addresses Section
This is the first tab you see when you switch to the Manage Networking section, here you see your assigned network addresses (IPv4 and IPv6) and their respective netmask and gateways.
On the right hand side you see “Traffic Usage for <Month> <Year>, this gives you a quick look at this months traffic usage.
Network Usage Graph
The Network Usage Graph Section
A new entry into the interface is the Network Usage Graph, this introduces a long requested feature of day-wise network usage in a easy to understand graph, The graph is a bar chart which is super helpful to analyze network usage patterns, for example to help find out which are the most popular days for your website/server!
Previous Usage
The Previous Usage Section
The Previous Usage section brings another long requested feature to the user interface, this will help users plan out their bandwidth allocations in the long term! For example, if you moved over a website to your server this month and wanted to know how much “extra” traffic it bought to your server? now you can know without any extra effort or application needed!
We’re glad to introduce the above improvements in the Manage Network interface and we believe this will simplify and help users with the Network Management side of things of your server with us!
Stay tuned for more previews to come soon of the other new redesigned parts of the interface!
We’ve been working on a new design for our control panel and we’re glad to unveil the first redesigned feature today — Snapshots!
the new redesigned snapshot interface
As seen in the above image, we’ve redesigned out the snapshot interface to be clearer and more informative while making good use of the space available.
The first thing you see is the long character-numeric string, the snapshot-UUID, this is vital when trying to address the snapshot with when using our API (more information soon!)
Below which you see the size of the snapshot, ideal to compare with if the snapshot has been built correctly, below which finally you see a timestamp of when the snapshot was created
Last but not least, the buttons! You see the 3 buttons, one to restore and one to delete the snapshot, the delete snapshot button has been marked in red, simple yet effective, while the restore and create snapshot buttons remain in blue.
We hope you’re as excited as we are with the upcoming panel redesign!
Debian 10 “Buster” is now available under our 1-Click Installer in our control panel!
As always, we also have an ISO/CD-ROM install method available for customers who are looking to create custom partition layouts, pre-install different packages etc.
The latest release of CentOS — CentOS 8 is now available on all our KVM powered plans!
As always, we also have a ISO/CD-ROM install method available for CentOS 8 for customers who are looking to create custom partition layouts, pre-install different packages etc.