Hey There!
Continuing with our previous series of previewing out our new user interface, today we’re happy to preview out the new & redesigned Manage Network Interface!
Checkout the previous post about our Redesigned Snapshot Interface
To begin with, we’ve split the Manage Network interface into 3 parts, to give us more “space” to work with for each item,
- Network Addresses
- Network Usage Graph
- Previous Usage

Network Addresses
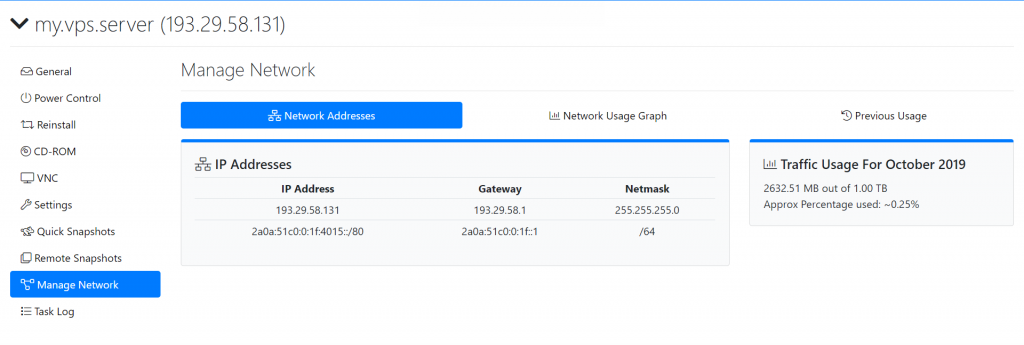
This is the first tab you see when you switch to the Manage Networking section, here you see your assigned network addresses (IPv4 and IPv6) and their respective netmask and gateways.
On the right hand side you see “Traffic Usage for <Month> <Year>, this gives you a quick look at this months traffic usage.
Network Usage Graph
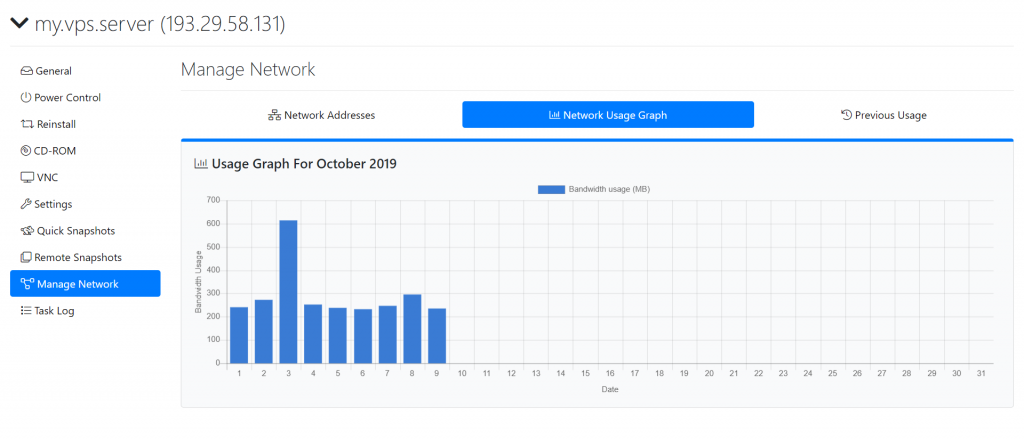
A new entry into the interface is the Network Usage Graph, this introduces a long requested feature of day-wise network usage in a easy to understand graph, The graph is a bar chart which is super helpful to analyze network usage patterns, for example to help find out which are the most popular days for your website/server!
Previous Usage
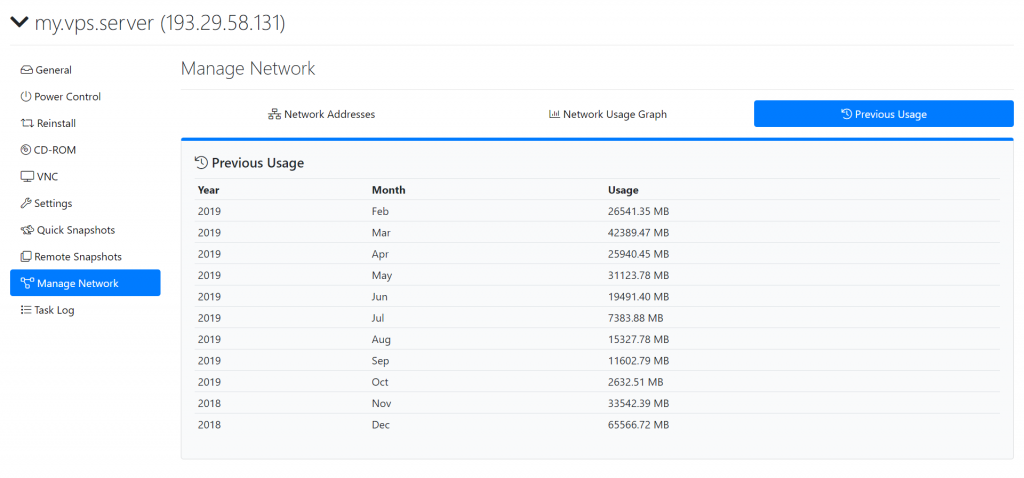
The Previous Usage section brings another long requested feature to the user interface, this will help users plan out their bandwidth allocations in the long term! For example, if you moved over a website to your server this month and wanted to know how much “extra” traffic it bought to your server? now you can know without any extra effort or application needed!
We’re glad to introduce the above improvements in the Manage Network interface and we believe this will simplify and help users with the Network Management side of things of your server with us!
Stay tuned for more previews to come soon of the other new redesigned parts of the interface!