Exciting news! We’re thrilled to unveil a enhancement to our hosting experience – introducing real-time CPU and IO usage graphs for your Virtual Private Servers (VPSes) right from our user-friendly CrownPanel.
What’s In Store?
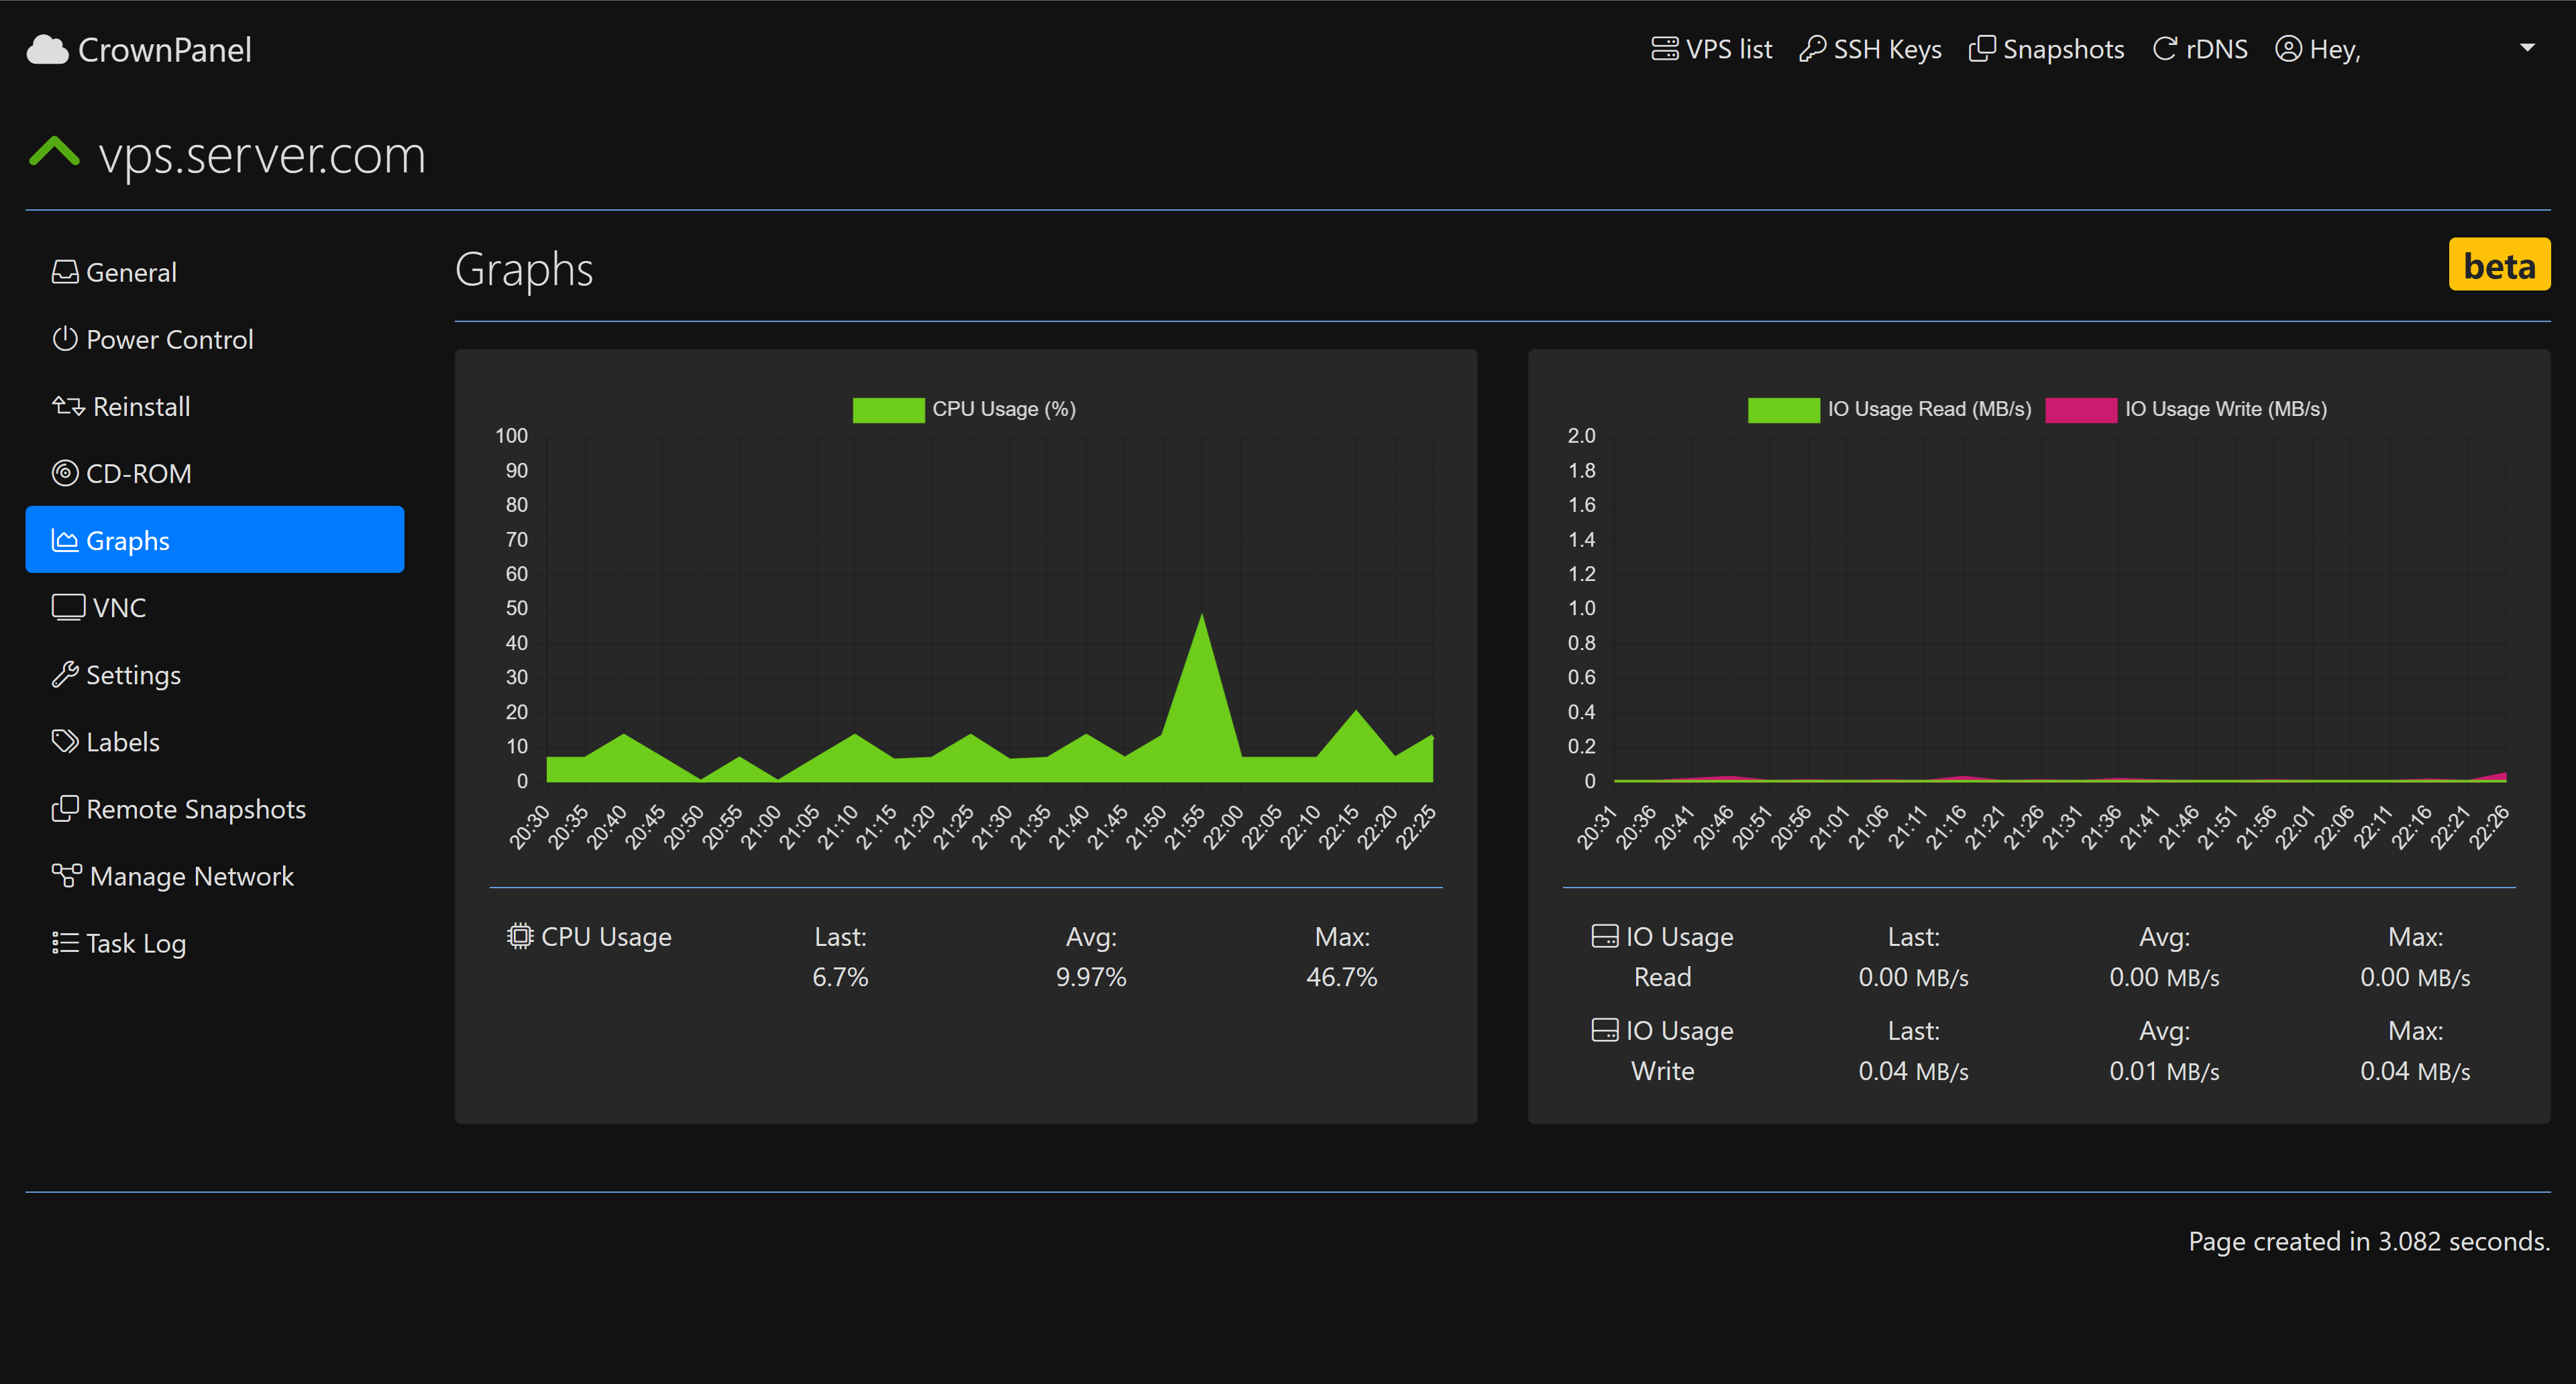
1. Dynamic CPU Usage Graphs:
- Dive deep into your VPS’s CPU performance with real-time insights.
- Identify trends and patterns to optimize resource allocation.
- Empower yourself with the data you need to enhance your VPS performance.
2. IO Usage Graphs:
- Uncover the nuances of your VPS’s Input/Output activities.
- Make data-driven decisions to fine-tune disk performance.
- Stay ahead of potential bottlenecks and keep your VPS running smoothly.
Accessing the Graphs:
Discovering the power of these new graphs is a breeze. Log in to our CrownPanel, navigate to your VPS, and explore the “Graphs” tab. Your VPS’s performance data is just a click away.

Why You’ll Love It:
Monitoring your VPS’s resource usage has never been this insightful. With our new graphs feature, you’re equipped to proactively manage and optimize your VPS environment, ensuring peak performance around the clock.
What’s on the Horizon:
This is just the beginning! We’re committed to delivering a hosting experience that exceeds your expectations. Stay tuned for more feature updates and improvements as we continue to elevate your hosting journey.
Embark on a journey of unparalleled control and performance by exploring the new graphs feature today.
We value your input! If you come across anything that could be improved or have suggestions for enhancing your experience, please don’t hesitate to reach out by opening a support ticket. Your feedback helps us continually refine and enhance our services to better serve you.
Thank you for making CrownCloud your hosting partner of choice.
Best regards,